


 26 / 30

Tertiary Destinations
ACU
3%
ANU
9.5%
Deakin Universit
y 21%
La Trobe University
3%
Monash University
21 %
RMIT University
11%
Swinburne University of Technolog
y 1.5 %
University of Melbourne
28.5%
International University USA
1.5%
STUDENT ATTENDANCE
At Ruyton student attendance is recorded on-line by
teachers using Seqta, a computer software system.
Attendance is recorded for morning Roll Call and for each
lesson throughout the day. The School Assistant checks the
morning Roll Call data and contacts parents to check on
unexplained student absences. During the course of the
day, the School Assistant and Level Co-ordinators monitor
student absence to detect any unexplained absence from
class. Parents are contacted when appropriate.
Each year the Department of Education, Employment and
Workplace Relations (DEEWR) undertakes the task of
collecting attendance data from non-government schools
for Years 1 to 10. The data collected by DEEWR is forwarded
to the Australian Curriculum, Assessment and Reporting
Authority (ACARA) for publication on its ‘My School’
website. The period for recording attendance data in
2014 was semester 1 between Monday 3 February and
Friday 27 June.
Ruyton’s overall rate of attendance for the collection period
was 97 per cent. Individual year level attendance was as
follows:
Year 1:
96%
Year 6:
97%
Year 2:
98%
Year 7:
97%
Year 3:
98%
Year 8:
97%
Year 4
: 97%
Year 9:
95%
Year 5:
98%
Year 10:
96%
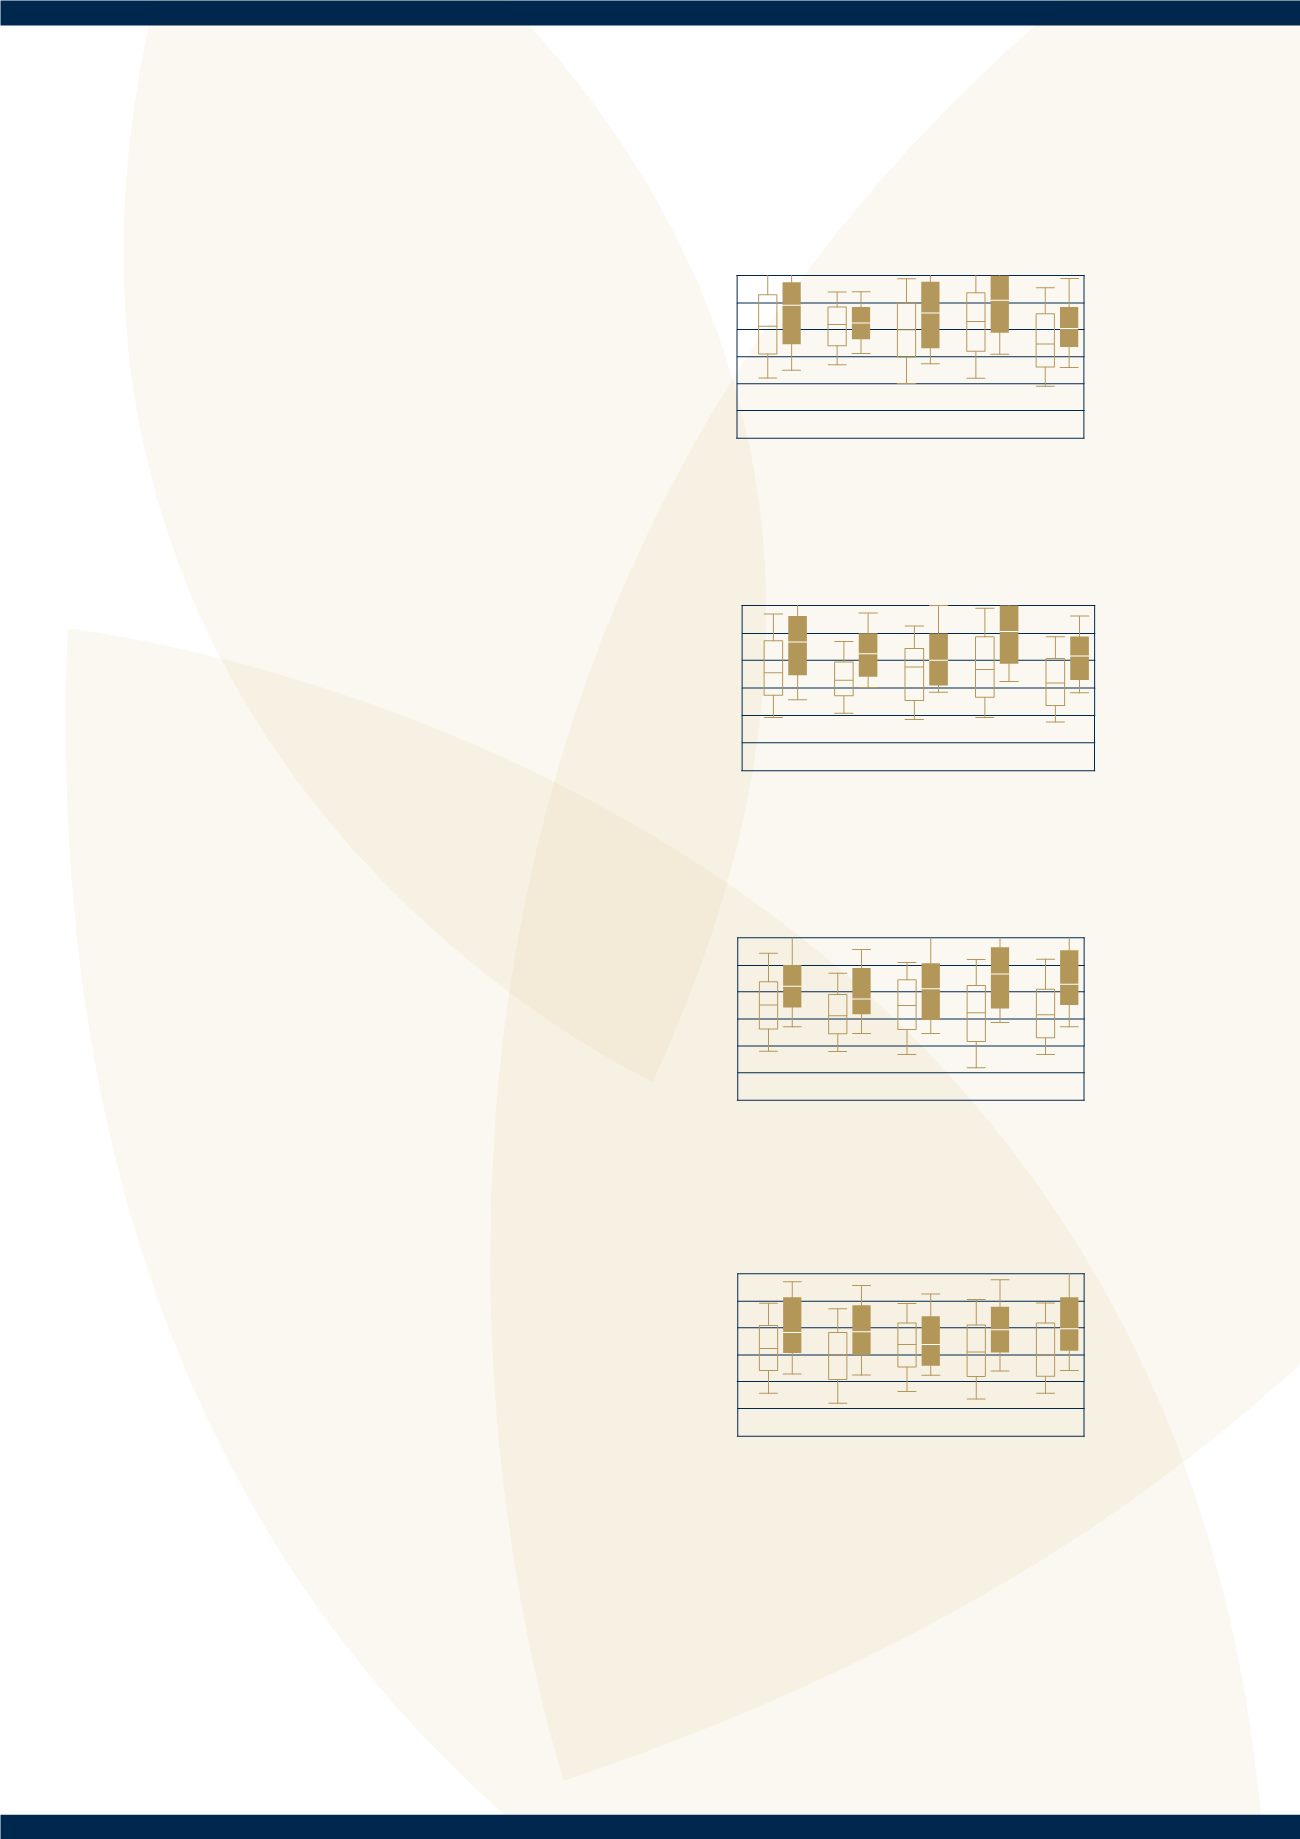
NAPLAN (National Assessment Plan)
Students in Years 3, 5, 7 and 9 undertake the NAPLAN
testing over a three day period in May. Individual reports
were generated by the Victorian Curriculum and
Assessment Authority (VCAA) and were posted to parents.
The graphs below show Ruyton’s results compared with the
State results. (Please note National results were not
included in the data in 2014). The yellow box represents
students in the state education system and the red box
represents Ruyton students. The graphs indicate
performance in key learning areas and show achievement
in a box and whisker format. The box represents the middle
50 per cent of the students’ scores and the middle score
(median) for the group is shown by the black line. The
whiskers show the range of scores achieved by the middle
80 per cent of the students. The figures on the left axis
indicate Victorian Essential Learning Standards Levels. Level
1 to 6 represents year levels from Prep to Year 10.
Year 3:
In 2014, all students in Year 3 met the national benchmarks
for Reading,Writing, Spelling, Grammar and Punctuation,
and Numeracy.
Year 5:
In 2014, all students in Year 5 met the national benchmarks
for Reading,Writing, Grammar and Punctuation, Spelling
and Numeracy.
Year 7:
In 2014, all students in Year 7 met the national benchmarks
for Writing, Spelling, Grammar, Punctuation Reading
and Numeracy.
Year 9:
In 2014, all students in Year 9 met the national benchmarks
for Reading,Writing, Grammar and Punctuation, Spelling
and Numeracy.
Reading
Band
Scaled Score
8
7
6
5
4
3
582
530
478
426
374
322
Writing Spelling
Grammar &
Punctuation Numeracy
Reading
Band
6
5
4
3
2
1
478
530
426
374
322
270
Writing Spelling
Grammar &
Punctuation Numeracy
Scaled Score
Reading
Band
Scaled Score
9
8
7
6
5
4
634
582
530
478
426
374
Writing Spelling
Grammar &
Punctuation Numeracy
Reading
Band
Scaled Score
10
9
8
7
6
5
686
634
582
530
478
426
Writing Spelling
Grammar &
Punctuation Numeracy
Annual Report 2014
26